Chapter 2 / 6 · Economy

The World's Biggest Market

The United States produces about a quarter of the world's output, issues its main currency and buys more imports than any other nation. That power brings influence, and hard questions.

8 min read25 sources

Photo: King of Hearts · CC BY-SA 4.0

$30.8T
US GDP in 2025, about 26% of world output at market exchange rates
IMF, 2026
57.1%
Share of the world's allocated foreign exchange reserves held in dollars, early 2026
IMF COFER, 2026
89.2%
Share of all currency trades with the dollar on one side, April 2025
BIS, 2025
43.7%
US share of global stock market value in 2025
SIFMA, 2026
$3.51T
US goods imports in 2025, the largest of any country
WTO, 2026
13.6M
Barrels of crude oil the US produced per day in 2025, a world record
EIA, 2026

No country produces more at market prices or buys more from abroad than the United States. Its $30.8 trillion economy is more than half as large again as China's, the dollar sits on one side of almost nine in ten currency trades, and New York hosts the world's biggest stock markets. America is also now the top producer of oil and natural gas. This chapter explains where that economic weight comes from, how it links to the rest of the world through trade and finance, and why debt, inequality, tariffs and the power of the dollar are hotly debated at home and abroad.

The world's largest economy

Measured in US dollars at market exchange rates, the United States produced about $30.8 trillion of goods and services in 2025, according to IMF estimates. That is roughly 26% of everything the world produced.1 China came second at about $19.6 trillion. The 27 countries of the European Union, taken together, produced about $21.2 trillion.1

The gap to the next single countries is wide. Germany produced about $5.0 trillion in 2025, Japan about $4.4 trillion, the United Kingdom $4.0 trillion and India $3.9 trillion. The IMF projects the US economy will pass $32 trillion in 2026.1

There is another way to compare economies. Prices for haircuts, rent or rice are much lower in China and India than in the US, so the same dollar buys more there. Adjusting for this gives a measure called purchasing power parity (PPP). On that basis China is the largest economy, with about 19.6% of world output in 2025, against 14.6% for the US.1 Both measures are useful: market rates show buying power on world markets, while PPP is closer to local living standards.

Americans are also rich on average. US output per person was about $90,000 in 2025, compared with about $60,400 in Germany, $47,100 across the EU, $36,000 in Japan and $14,000 in China.1 US growth has also been steady for a large, mature economy: real GDP grew 2.1% in 2025, faster than the EU's 1.6% and Germany's 0.2%, though slower than China's 5.0% and India's 7.6%.1

Part of the story is a culture of starting things. Americans filed a record 5.67 million applications to form new businesses in 2025, up from about 3.5 million in 2019, before the pandemic.13 Not every application becomes a company that hires workers, but the number shows how many people try.

The Golden Gate Bridge in San Francisco, a red suspension bridge spanning the entrance to the bay
Bridges, highways and ports such as San Francisco's Golden Gate Bridge link a home market that stretches across a continent, letting US firms grow large before selling abroad.Photo: Frank Schulenburg · CC BY-SA 4.0

How the big economies compare

Nominal GDP in 2025, converted to US dollars at market exchange rates. The EU is shown as one bloc for comparison; Germany is also counted inside it.

Nominal GDP, 2025

Trillions of US dollars at market exchange rates (IMF estimates)

  • United States $30.8T
  • European Union (27) $21.2T
  • China $19.6T
  • Germany $5T
  • Japan $4.4T
  • United Kingdom $4T
  • India $3.9T
Source: IMF World Economic Outlook database, April 2026. 2025 values are IMF estimates.

Exchange rates move these numbers. When the dollar rises, other economies look smaller in dollar terms even if nothing has changed at home, which is why the IMF also publishes PPP figures.1

The dollar and Wall Street

The US dollar is the world's main reserve currency: the money that central banks hold to pay for imports, defend their own currencies or survive a crisis. In the first quarter of 2026, 57.1% of the world's allocated foreign exchange reserves were held in dollars. The euro came second with 20.0%, the Japanese yen had 5.4% and the Chinese renminbi 2.0%. Total reserves were $13.1 trillion.2

That share has slowly drifted down, from about 71% in 1999 to 56.4% at the end of 2025, before ticking up in early 2026.2 Much of that space went not to the euro but to the renminbi and a mix of smaller currencies, such as the Canadian and Australian dollars, which together held about 10% of reserves in 2025.2

In day-to-day markets the dollar's role is even larger. Currency trading averaged $9.6 trillion a day in April 2025, and the dollar was on one side of 89.2% of all trades, up from 88.4% in 2022.3 Because it is so widely traded, it works as a bridge: a bank swapping Korean won for Brazilian reais often goes through dollars. The dollar is also used for about 60% of foreign-currency debt issued around the world, and roughly half of all US banknotes, around $1 trillion, are held outside the country.4

This brings real benefits. Because foreigners want dollars and dollar bonds, the US government and US companies can usually borrow in their own currency at lower cost, and Americans rarely worry about exchange rates when they buy oil or sell abroad. Economists often call this the dollar's "exorbitant privilege." There is a flip side. Strong demand can keep the dollar expensive, which makes US exports cost more, and decisions by the Federal Reserve on interest rates spread quickly to countries that owe money in dollars.

Behind the dollar stand the world's largest capital markets. In 2025 the US stock market was worth $68.9 trillion, or 43.7% of the global total of $157.8 trillion. US bond markets held 38.1% of the world's debt securities, about $61.2 trillion.5 Companies from around the world list shares in New York, and investors buy US Treasury bonds as a safe place to park money.

This system has deep roots. Alexander Hamilton, the first Treasury Secretary, insisted that the new country repay its Revolutionary War debts in full, and in 1791 he set up the First Bank of the United States.17 Building a reputation for paying debts on time is one reason investors still trust US government bonds today.

The debt of the United States ... was the price of liberty.
Alexander Hamiltonfirst Secretary of the Treasury, 1790
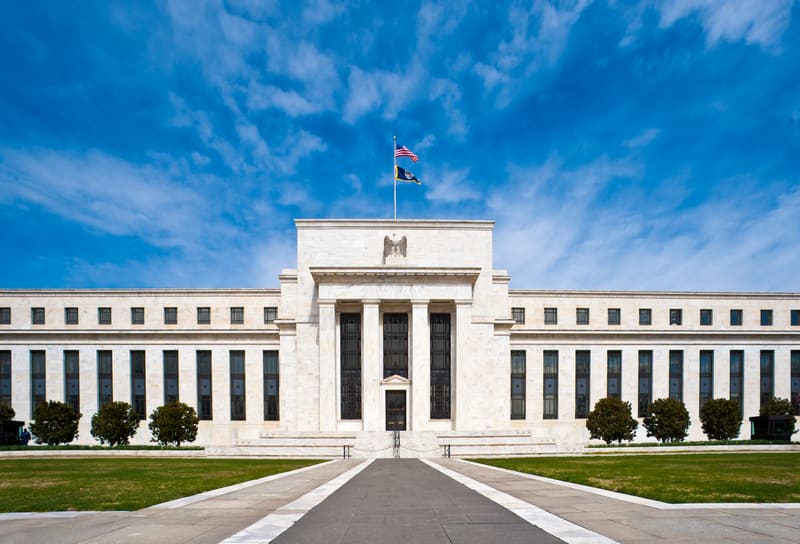
The white marble facade of the Federal Reserve's Eccles Building in Washington, D.C.
The Marriner S. Eccles Building in Washington, D.C., headquarters of the Federal Reserve Board. Decisions made here on interest rates ripple through markets worldwide because so much global borrowing is in dollars.Photo: Federalreserve · Public domain

The dollar's share of world reserves

Share of allocated official foreign exchange reserves held in each currency, end of each year, 1999 to 2025.

Currency shares of world foreign exchange reserves

Percent of allocated reserves, end of year

0%20%40%60%80% 200020052010201520202025 US dollar 56.4%Euro 20.4%Japanese yen 5.8%Chinese renminbi 2%
US dollarEuroJapanese yenChinese renminbi
Source: IMF COFER database, accessed September 2026. Renminbi reported separately from 2016.

The dollar's share has fallen by about 15 percentage points since 1999, but no single rival has replaced it. The euro's share in 2025 was close to where it started, and the renminbi has stayed near 2%.2

Shares also move with exchange rates, because reserves are measured in dollars. The IMF found that about half of the dollar's small rise in early 2026 came simply from the dollar strengthening against other major currencies.2

The world's biggest customer

The United States is the world's largest importer of goods. In 2025 it bought $3.51 trillion of merchandise from abroad, 13.2% of world imports, well ahead of China's $2.58 trillion.6 It is also the largest trader in services such as finance, software, travel and film: US services exports reached $1.21 trillion in 2025, 12.7% of the world total.6 If the EU is counted as a single unit, though, its services trade is larger.6

Counting goods and services together, US exports were $3.43 trillion in 2025 and imports $4.33 trillion, leaving a deficit of $901.5 billion. The country ran a large deficit in goods but a surplus of $339.5 billion in services.7 Services exports grew most in business services, charges for the use of intellectual property such as software and patents, and financial services.7

The largest goods deficits in 2025 were with the EU ($218.8 billion), China ($202.1 billion), Mexico ($196.9 billion) and Vietnam ($178.2 billion). The gap with China shrank by $93.4 billion in a single year, while the deficits with Taiwan and Vietnam grew.7

The EU is the largest trading partner as a bloc, while Mexico and Canada, America's neighbors and partners in the USMCA trade agreement, are the top single countries.8 Trade with China has shrunk fast. US imports from China fell 29% in 2025, and China's share of US imports dropped from 13.8% to 9.3% in one year, while imports from Taiwan, Vietnam, India and other Asian economies rose.6

The rules behind this trade were largely shaped at the end of the Second World War. In July 1944, delegates from 44 nations met at Bretton Woods, New Hampshire, and created the International Monetary Fund and the World Bank.14 In 1947, 23 nations meeting in Geneva agreed on the General Agreement on Tariffs and Trade (GATT), which cut tariffs and set trade rules for almost fifty years until the World Trade Organization replaced it in 1995.14

Other currencies were pegged to the dollar, and the dollar to gold, until August 15, 1971, when President Nixon ended the dollar's convertibility into gold.15 The US remains the IMF's largest shareholder, with about 16.5% of votes. Because major decisions need 85%, it can block them on its own.16

Trade policy has changed sharply since 2025. Citing national emergencies, the administration used a 1977 law, the International Emergency Economic Powers Act (IEEPA), to impose a 25% tariff on most imports from Canada and Mexico, 10% on most imports from China, and a "reciprocal" tariff of at least 10% on imports from all trading partners.24 On February 20, 2026, the Supreme Court ruled 6-3 that IEEPA does not authorize the president to impose tariffs.24

Other tariffs followed under different laws. By August 2026, after new Section 301 tariffs replaced a temporary tariff that expired on July 24, the average statutory US tariff rate was 11.0%, according to Yale's Budget Lab.23
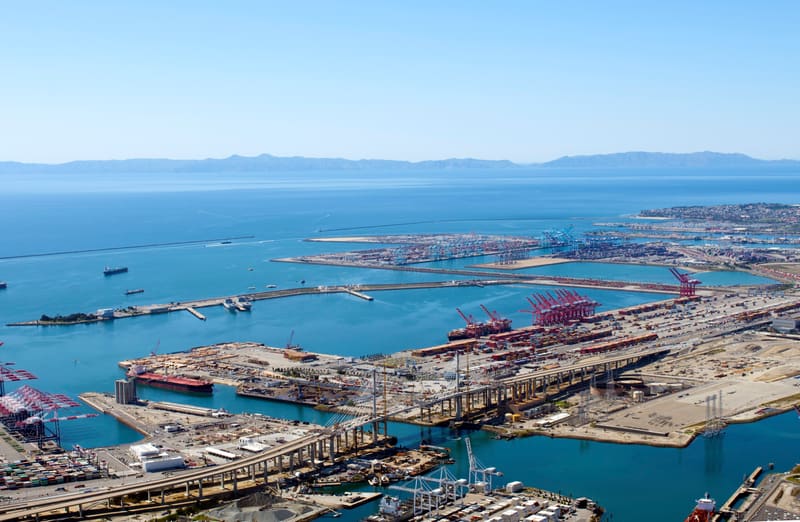
Stacks of shipping containers and large cranes along the docks at the Port of Los Angeles and Long Beach
Container ships and cranes at the ports of Los Angeles and Long Beach, the busiest gateway for goods arriving from Asia.Photo: Don Ramey Logan · CC BY-SA 4.0

Top trading partners

Total US trade in goods (exports plus imports) with the largest partners in 2025, Census basis. The EU is shown as one bloc.

Largest US goods trading partners, 2025

Exports plus imports of goods, billions of US dollars

  • European Union (27) $1,045B
  • Mexico $872B
  • Canada $716B
  • China $415B
  • Taiwan $256B
  • Japan $227B
  • Vietnam $210B
  • South Korea $195B
  • United Kingdom $162B
Source: US Census Bureau, Trade in Goods by Country, annual 2025, Census basis, not seasonally adjusted.

Most partners sell more to the US than they buy. The United Kingdom was an exception in 2025: the US exported about $97 billion of goods there and imported about $65 billion.8

Farms, oil and gas

The US is a leading food exporter. American farm exports were worth about $171 billion in 2025, down from a peak in 2022 as world crop prices fell and a strong dollar made US goods more expensive. The top products were corn, soybeans, tree nuts such as almonds, dairy products and beef.12 Soybean exports fell in 2025, while corn, tree nut and dairy exports grew.12

The biggest change of the past twenty years is in energy. Thanks to the shale revolution, which combined horizontal drilling with hydraulic fracturing to release oil and gas from dense rock, the US has been the world's largest crude oil producer since it overtook Russia in 2018. In 2025 it pumped a record 13.6 million barrels a day, about 40% more than Russia (9.9 million) or Saudi Arabia (9.6 million).9 Almost half came from the Permian region of western Texas and southeastern New Mexico.9

The US has also been the largest producer of natural gas since 2009. In 2023, the latest year with full world data, it produced 104 billion cubic feet a day, 75% more than Russia, the second-largest producer.10 A growing share now leaves the country as liquefied natural gas (LNG), gas cooled to a liquid and shipped in tankers. US LNG exports rose 26% in 2025 to 15.1 billion cubic feet a day, 26% of the world total, ahead of Qatar and Australia.11

Energy has changed America's position in the world. For decades the country worried about depending on imported oil. Today it is a major energy exporter. LNG shipped to Europe and Asia gives buyers an alternative to other suppliers, including Russia, and gives Washington another tool in diplomacy.
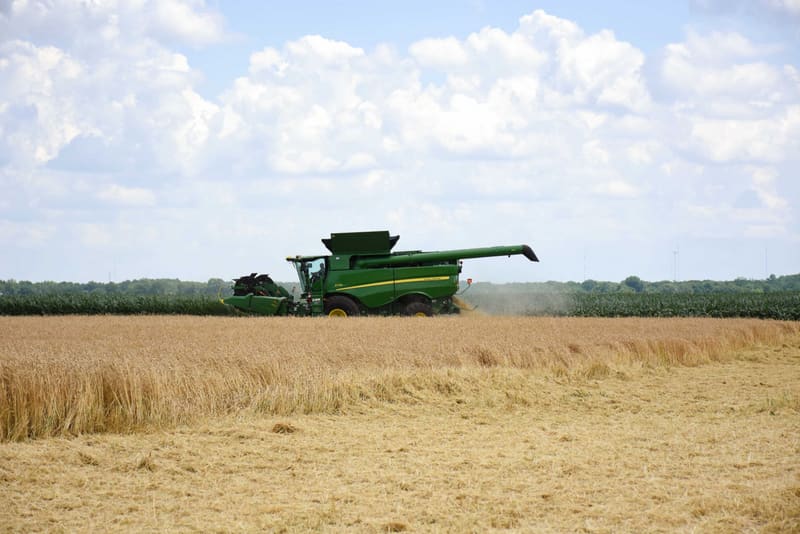
A combine harvester cutting a field of ripe grain under a wide sky
A combine harvests grain on a US farm. Corn and soybeans are the country's two largest farm exports.Photo: USDAgov · Public domain

Timeline

Milestones of the American economy

From Hamilton's bank to the tariff fights of 2026, key moments in how the US economy grew and shaped the world's.

  1. 1791

    First Bank of the United States

    Hamilton's national bank opens. It acts as the Treasury's financial agent, holds public money and issues paper currency.17

  2. 1901

    The birth of US Steel

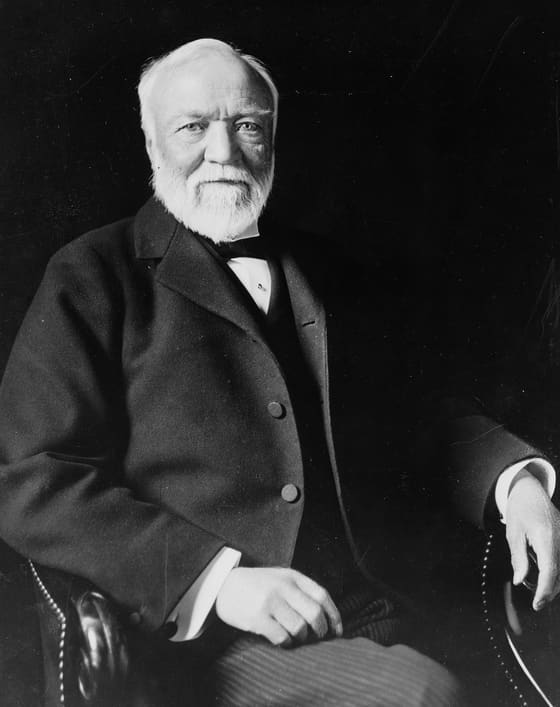
    Andrew Carnegie sells his steel company to J. P. Morgan for $480 million. It becomes the core of the new United States Steel Corporation.18

  3. 1913

    The moving assembly line

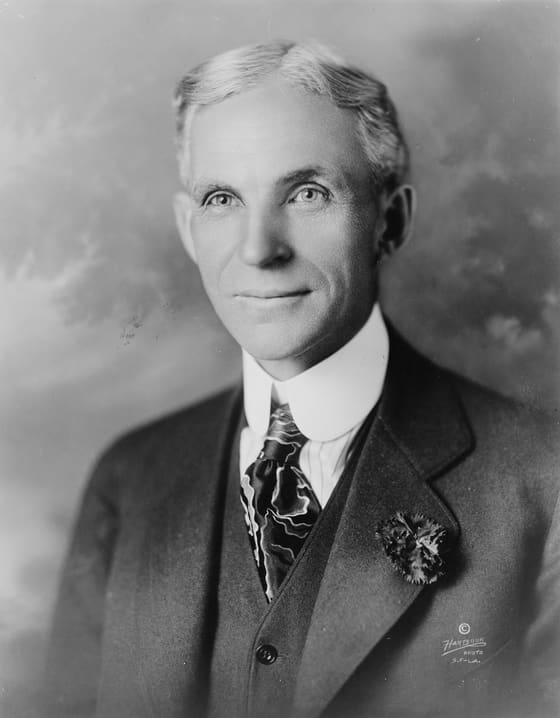
    Ford introduces the moving assembly line at Highland Park, Michigan, cutting the time to build a Model T from 12.5 hours to 93 minutes.19

  4. 1944

    Bretton Woods

    Delegates from 44 nations create the IMF and World Bank at a conference in New Hampshire, with the dollar at the center of the new system.14

  5. 1971

    The gold window closes

    On August 15, President Nixon ends the right of foreign governments to swap dollars for gold at $35 an ounce, opening the era of floating currencies.15

  6. 2009

    Top natural gas producer

    Shale drilling makes the US the world's largest producer of natural gas, a position it still holds.10

  7. 2018

    Top oil producer

    The US overtakes Russia to become the world's largest crude oil producer. Output reaches a record 13.6 million barrels a day in 2025.9

  8. 2022

    Sanctions on Russia's central bank

    After Russia invades Ukraine, the Treasury bars Americans from transactions with Russia's central bank, freezing its assets held in the US or by US persons.25

  9. 2025

    Emergency tariffs

    The president uses emergency powers (IEEPA) to impose tariffs on Canada, Mexico, China and, through "reciprocal" tariffs, all trading partners.24

  10. 2026

    Supreme Court ruling

    On February 20, the Supreme Court rules 6-3 that IEEPA does not allow the president to impose tariffs.24

  11. 2026

    New tariffs replace old

    Temporary tariffs expire on July 24 and are replaced by new Section 301 tariffs. The average statutory tariff rate stands at 11.0% in August.23

People

People who built the economy

A founder, two industrialists and a president whose choices still shape how Americans earn, borrow and trade.

Alexander Hamilton
1757–1804

Alexander Hamilton

First Secretary of the Treasury

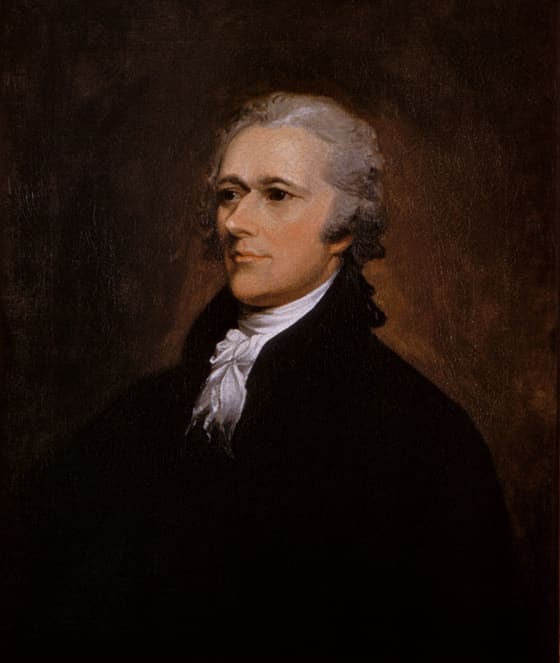
Serving under George Washington from 1789 to 1795, Hamilton insisted the young republic repay its war debts, created a revenue system based on customs duties and taxes, and launched the First Bank of the United States in 1791. He also pushed for the US Mint, founded in 1792.17

Photo: John Trumbull · Public domain
Andrew Carnegie
1835–1919

Andrew Carnegie

Steel industrialist and philanthropist

A Scottish immigrant who arrived at 13 and started as a bobbin boy earning $1.20 a week, Carnegie built a steel empire and sold it for $480 million in 1901. He then gave away about $350 million, funding 2,509 libraries worldwide.18

Photo: Theodore C. Marceau · Public domain
Henry Ford
1863–1947

Henry Ford

Founder of Ford Motor Company

Ford did not invent the car, but he made it affordable. His moving assembly line, introduced in 1913, cut assembly time for a Model T from 12.5 hours to 93 minutes. The car's price fell from $850 in 1908 to $260 by 1924, putting millions of families on the road.19

Photo: Hartsook, photographer · Public domain
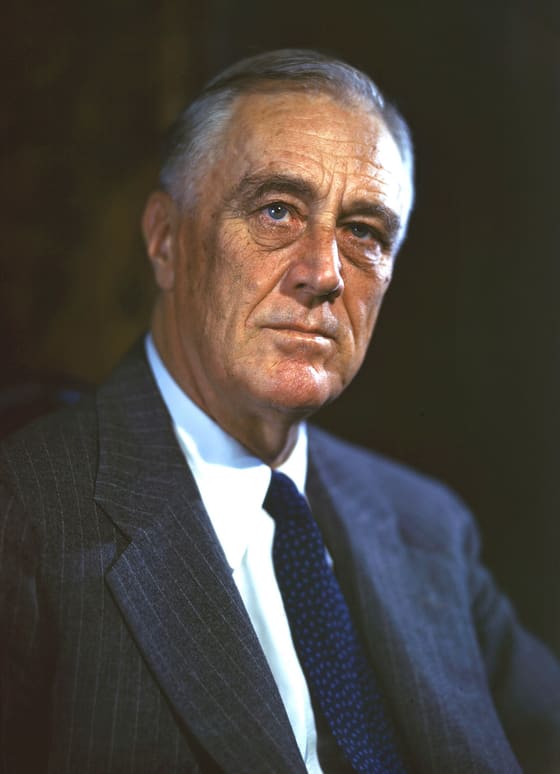
Franklin D. Roosevelt
1882–1945

Franklin D. Roosevelt

32nd President of the United States

Roosevelt led the country through the Great Depression and the Second World War. His New Deal expanded the federal role in banking, jobs and social insurance. His government hosted the 1944 Bretton Woods conference, where 44 nations designed the postwar money system and created the IMF and World Bank.14

Challenges & debates

Challenges and debates

America's economic strength is real, but so are the arguments about its costs and risks. Here are four of the biggest, with the strongest case on each side.

Economists disagree on all four questions, and the evidence often supports parts of both arguments, so it is worth weighing each side on its merits.

Are federal debt and deficits a serious danger?

Critics argue

The Congressional Budget Office projects a deficit of about $1.9 trillion in fiscal 2026 and debt held by the public rising from 101% of GDP to 120% by 2036, above the 1946 record of 106%.20

Interest costs alone reach about $1 trillion in 2026 and are projected to double over the decade, crowding out spending on other priorities and leaving less room to respond to a crisis.20

Supporters respond

The US borrows in its own currency, and investors worldwide still want dollar assets: US bond markets hold 38.1% of the world's debt securities.5

Many economists argue debt matters mainly relative to growth, and that well-chosen spending on research, infrastructure and people can pay for itself over time; the real question is how to slow debt growth without a sudden shock.

Does US prosperity reach most people?

Critics argue

Wealth is highly concentrated. In mid-2026 the richest 1% of households held 32.5% of all household net worth, while the bottom half held just 2.3%.21

Household income grew 1.7% at the 90th percentile in 2025 but did not change significantly at the 10th percentile, so gains at the top have outpaced those at the bottom.22

Supporters respond

Median household income reached $87,460 in 2025, the highest on record since data began in 1967.22

Taxes and credits reduce inequality: the Census Bureau finds inequality is lower when measured after taxes, and median income after taxes and credits rose 3.1% in 2025.22

Do tariffs protect American workers, or hurt consumers?

Critics argue

Yale's Budget Lab estimates current tariffs cost the average household about $1,100 a year and raise consumer prices by about 0.7%.23

The Supreme Court found in 2026 that the emergency law used for the 2025 tariffs did not authorize them, and frequent changes create uncertainty for businesses planning investments.24

Supporters respond

Supporters argue that large, persistent trade deficits, $901.5 billion in 2025, reflect unfair practices abroad and have hollowed out parts of US manufacturing.7 24

Tariffs raise money: Yale's Budget Lab estimates current tariffs will bring in about $1.9 trillion over ten years, and they give the US leverage in trade talks.23

Is the dollar being "weaponized," and will the world turn away from it?

Critics argue

Freezing the assets of Russia's central bank in 2022 showed that reserves held in dollars can be blocked, giving other countries a reason to diversify.25

The dollar's share of world reserves has fallen from about 71% in 1999 to around 57% in 2026, a slow but steady decline.2

Supporters respond

Sanctions target specific governments for specific actions, such as Russia's invasion of Ukraine, and are usually coordinated with allies.25

No rival has taken the dollar's place. The renminbi holds only about 2% of reserves, and the dollar is on one side of 89.2% of currency trades, a share that rose between 2022 and 2025.2 3

Did you know?

Did you know?

About half

Roughly half of all US dollar banknotes, around $1 trillion, are held outside the United States.4

96%

Share of trade invoicing in the Americas done in US dollars. Even in Asia-Pacific the figure is 74%.4

5.67M

Applications to start new US businesses filed in 2025, an all-time record.13

26%

Share of the world's liquefied natural gas exports that came from the United States in 2025.11

Sources

Where the numbers come from

Every figure on this page links to a primary or reputable source. Numbers are the latest available at the time of writing.

  1. IMF, World Economic Outlook database, April 2026 (GDP in current US dollars, GDP per capita, PPP share of world GDP, real growth) — imf.org
  2. IMF, Currency Composition of Official Foreign Exchange Reserves (COFER) database, and data brief for 2026Q1, July 1, 2026 — data.imf.org
  3. Bank for International Settlements, Triennial Central Bank Survey: OTC foreign exchange turnover in April 2025 — bis.org
  4. Federal Reserve Board, FEDS Notes: The International Role of the U.S. Dollar, 2025 Edition, July 18, 2025 — federalreserve.gov
  5. SIFMA, 10 Key Findings from SIFMA's 2026 Capital Markets Fact Book, 2026 — sifma.org
  6. World Trade Organization, Global Trade Outlook and Statistics, March 2026 (incl. Appendix Table 1, leading traders in 2025) — wto.org
  7. US Bureau of Economic Analysis, U.S. International Trade in Goods and Services, December and Annual 2025, 2026 — bea.gov
  8. US Census Bureau, Trade in Goods by Country (annual totals, 2025) — census.gov
  9. US Energy Information Administration, The United States produced more crude oil than any other country in 2025, July 9, 2026 — eia.gov
  10. US Energy Information Administration, Three U.S. regions each produce more natural gas than most countries, November 7, 2025 — eia.gov
  11. US Energy Information Administration, Global liquefied natural gas trade volumes reached record high in 2025, July 14, 2026 — eia.gov
  12. USDA Economic Research Service, U.S. agricultural export values of bulk products fall in 2025 (chart gallery), 2026 — ers.usda.gov
  13. US Census Bureau, Business Formation Statistics (monthly business applications, 2019-2025) — census.gov
  14. US Department of State, Office of the Historian, Bretton Woods-GATT, 1941-1947 — history.state.gov
  15. Federal Reserve History, Nixon Ends Convertibility of US Dollars to Gold and Announces Wage/Price Controls — federalreservehistory.org
  16. Congressional Research Service, The International Monetary Fund (IF10676) — congress.gov
  17. US Department of the Treasury, Alexander Hamilton (1789-1795), Prior Secretaries — home.treasury.gov
  18. Carnegie Corporation of New York, Andrew Carnegie's Story — carnegie.org
  19. Library of Congress, This Month in Business History: Ford Implements the Moving Assembly Line — guides.loc.gov
  20. Congressional Budget Office, The Budget and Economic Outlook: 2026 to 2036, February 2026 — cbo.gov
  21. Federal Reserve Board, Distributional Financial Accounts (shares of net worth by wealth percentile, 2026Q2) — federalreserve.gov
  22. US Census Bureau, Income in the United States: 2025 (P60-289), September 2026 — census.gov
  23. The Budget Lab at Yale, The State of U.S. Tariffs, August 24, 2026 — budgetlab.yale.edu
  24. Supreme Court of the United States, Learning Resources, Inc. v. Trump, No. 24-1287, decided February 20, 2026 — supremecourt.gov
  25. US Department of the Treasury, Treasury Prohibits Transactions with Central Bank of Russia and Imposes Sanctions on Key Sources of Russia's Wealth, February 28, 2022 — home.treasury.gov

Think you know it?

Test yourself with questions from this chapter — with explanations after every answer.